A regular column by Daniel Renner
In the day-to-day operation of a photonics startup, or any other business for that matter, financial statements are a fundamental tool to understand the health of the company. Engineers do not generally get formal training on this topic and must learn how to read and interpret financial statements on the go. The intent of this two-part article is to help engineers that have become budding businesspeople in this learning process.
There are three main financial statements:
- Balance Sheet
- Income Statement
- Cash Flow Statement
Balance Sheets show what a company owns and what it owes at a fixed point in time.
Income Statements show how much money a company made and spent over a period of time.
Cash Flow Statements show the exchange of money between a company and the outside world, also over a period of time
This is an important first distinction to keep in mind. Balance Sheets are a snapshot of the company value at an instant in time. Income Statements and Cash Flow Statements cover financial transactions over a period of time.
This is the second part of an article covering the topic of Financial Statements which will discuss Income Statements and Cash Flow Statements in detail. Balance Sheets were discussed in the first part of this series, published in the April 2020 issue of the IEEE Photonics Society Newsletter (Vol. 34, No.2; pages 11 14). I suggest that you read the previous part first, if you haven’t already done so, before continuing with this second part.
The IEEE Photonics Society Newsletter is published in print and also online, here: https://www.photonicssociety.org/images/files/publications/Newsletter/Photonics_Apr2020_Web.pdf
We explained the structure of Balance Sheets and how to read them in the previous article by following the story of Nortel Networks from 1997 to 2001 as an example. Nortel Networks Corporation was one of the dominant suppliers of telecommunications equipment in the 20th century with worldwide presence. In the year 2000, as a major participant in the “telecom bubble” burst, Nortel self-destructed, with tens of thousands of people losing their jobs and investors losing billions of dollars. We will use the Nortel story in this article as well, to learn about Income Statements and Cash Flow Statements. You will find a detailed account of what happened to Nortel during the “telecom bubble” in the previous part published in April 2020.
Income Statements
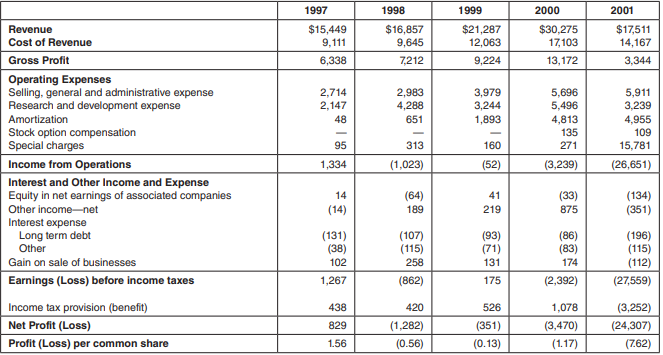
Let us have a close look at the Nortel Income Statements over those crucial years, from 1997 to 2001. The table below shows data for the five Income Statements corresponding to that period. Each Income Statement shows how much money the company made and spent from January 1st through December 31st of the corresponding year. Typically, when you look at an Income Statement it will only show one year, the year being discussed, and the previous year for comparison purposes. The information shown in the tables comes from Nortel Networks Annual Reports [1–3]. An Income Statement can also be referred to as Profit and Loss (P&L) Statement, Revenue Statement, Earnings Statement, Statement of Financial Performance or Statement of Operations. Different names for the same document!
At the top of the Income Statement is the total amount of money brought in from sales of products or services during the period in question. This top line is often referred to as Revenue or Sales.
The next line after Revenue shows the direct cost of generating the items sold, the Cost of Revenue. This number tells you the amount of money that the company spent to produce the goods or services it sold during the period.
The next line subtracts the Cost of Revenue from the Revenue to arrive to a subtotal called Gross Profit. It is considered “gross” because there are certain expenses that have not been deducted from it yet, such as administration, sales and R&D costs.
The next section deals with operating expenses. These expenses go toward supporting a company’s operations for a given period—for example, salaries of administrative personnel, costs of researching new products and marketing expenses. Operating expenses are different from “costs of sales” or “costs of revenue”, which were deducted above, because operating expenses cannot be linked directly to the production of the products or services being sold.
NORTEL NETWORKS CORPORATION
Consolidated Income Statement
Years Ended December 31st
(millions of U.S. dollars, except for share amounts)
Depreciation or Amortization is also deducted from gross profit. Depreciation takes into account the wear and tear on some assets, such as machinery, tools and furniture, which are used over the long term. Companies spread the cost of these assets over the periods they are used. This process of spreading these costs is called depreciation or amortization. The “charge” for using these assets during the period is a fraction of the original cost of the assets. Intangible assets, such as patents, copyrights and goodwill are also amortized.
There are two more items under Operating Expenses: Stock options and Special Charges. Many companies, particularly high tech start-ups use stock option compensation to incentivize employees. Stock options are an expense and they also appear, most commonly, under Operating Expenses. A Special Charge is a large one-time expense that the company does not expect to recur in future years; these are write-offs that are supposed to be one time events. They can be restructuring charges, discontinued operations charges or goodwill write-offs, for example. When analyzing the Income Statement, the nature of these write-offs needs to be understood as they can significantly distort company evaluations.
After all operating expenses are deducted from gross profit, you arrive at operating profit before interest and income tax expenses. This is often called “Income from Operations”.
Next, companies must account for income and expenses from interest and other sources. Interest income is the money companies make from keeping their cash in interest-bearing savings accounts, money market funds, and the like. On the other hand, interest expense is the money companies paid in interest for money they borrow. Some income statements show interest income and interest expense separately. Some income statements combine the two numbers.
There are several other income and expense items that can appear in this section. For example, many companies have influential, but noncontrolling investments in other firms (associated companies). They will account for income from these associated companies as a proportional share of the earnings in a line called “Equity in net earnings of associated companies” on their Income Statement. Also, if the company sold some businesses during the year, the gain or loss would appear in this section.
The interest and other income and expense are then added or subtracted from the operating profits to arrive at earnings or loss before income tax.
Finally, income tax is deducted and you arrive at the bottom line: net profit or net loss. (Net profit is also called net income or net earnings.) This tells you how much the company actually earned or lost during the accounting period. Notice that it is customary in accounting to show negative numbers in parentheses. We can have a Net Profit or (Net Loss).
Most income statements include a calculation of profit or earnings per share (EPS). This calculation tells you how much money shareholders would receive for each share of stock they own if the company distributed all of its net profit for the period.
Comments on the Nortel Income Statements:
- Nortel showed a healthy net profit in 1997, which was quickly turned into a loss in 1998 because of excessive spending in hastily acquired companies, part of the “telecom bubble”. Nortel posted a loss for every year from 1998 to 2001.
- The loss for 2001, at the time the bubble burst, was an astonishing $24.3 billion dollars, mostly driven by special charges that ballooned to $15.8 billion, which corresponded to goodwill write-off, the realization that the companies acquired over the previous three years were not worth as much as touted.
- The large Amortization increase in the years 2000 and 2001 was also due to the acquisition of overvalued companies. The large increase in Goodwill driven by these acquisitions stepped up Goodwill amortization.
- Revenue grew continuously from 1997 to 2000 but in 2001 it fell to almost half of what it was on the previous year. Nortel did not adjust its manufacturing, administrative, sales and R&D expenses fast enough, making the loss for 2001 even worse. Whilst the revenue in 2001 fell to almost half of that in 2000, the cost of revenue only went down by about 17%.
- In 2001, Nortel had a tax benefit, rather than a tax payment, of $3.2B. Otherwise its losses would have been even larger, at $27.6B. The tax benefit originated mainly from the goodwill write-off and R&D credits.
- In 1997, Cost of Revenue was 59% of Revenue; selling, general and administrative was 18% of Revenue; R&D was 14% of Revenue. These are fairly typical percentages of a well run high tech company.
- In contrast, by 2001, Cost of Revenue was 81% of Revenue; selling, general and administrative was 34% of revenue; R&D was 19% of Revenue. Clearly not a sustainable business situation.
Cash Flow Statements
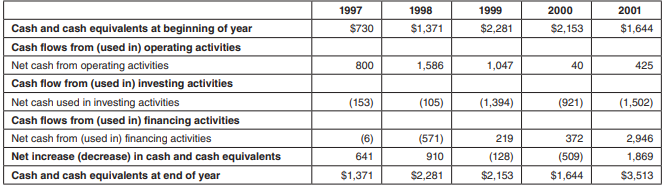
Last but not least, we will have a close look at the Nortel Cash Flow Statements from 1997 to 2001. The table below shows data for the five Cash Flow Statements corresponding to that period. Each Cash Flow Statement shows the company’s inflows and outflows of cash, from January 1st through December 31st of the corresponding year. Typically, when you look at a Cash Flow Statement it will only show one year, the year being discussed, and the previous year for comparison purposes. This information comes from Nortel Networks Annual Reports [1–3].
Cash Flow Statements are important because a company needs to have enough cash on hand to pay its expenses and purchase assets, needless to say. While an Income Statement can tell you whether a company made a profit, a Cash Flow Statement can tell you whether the company generated cash over the period in question. This is an important distinction, you should not confuse profit and cash flow. Just because a business is profitable doesn’t necessarily mean that it has sufficient cash flow to sustain itself. Profit is defined as revenue less expenses and it is the subject of the Income Statement analyis, as we just described. Earning revenue does not always increase cash immediately and incurring an expense does not always decrease cash immediately. Payment terms can delay cash inflow from revenue recognition by a month or two or even more. The same delay exists between recognition of purchases and cash outflow. If the company cannot finance its cash needs through regular business operations, it might need to get a loan. So, as you can see, cash flow is somewhat decoupled from the profit and loss generating events. Cash flow management is key to the survival of the business and the tool to help on this is the Cash Flow Statement.
The bottom of the Cash Flow Statement shows the net increase or decrease in cash and cash equivalents for the period. Cash equivalents are any short-term investments that have maturity periods of 90 days or less, i.e. investments that readily convert into cash. Generally, Cash Flow Statements are divided into three main parts. Each part reviews the cash flow from one of three types of activities: (1) operating activities; (2) investing activities; and (3) financing activities
NORTEL NETWORKS CORPORATION
Consolidated Cash Flow Statement
Years Ended December 31st
(millions of U.S. dollars)
The first part of a Cash Flow Statement, related to operating activities, analyzes a company’s cash flow from net profits or losses. For most companies, this section of the cash flow statement reconciles the net income (as shown on the Income Statement) to the actual cash the company received from or used in its operating activities. To do this, in addition to taking into account the delays to receive cash mentioned earlier, it also adjusts net profit for any non-cash items, such as adding back depreciation expenses.
The second part of a Cash Flow Statement, related to investing activities, shows the cash flow from all investing activities, which generally include purchases or sales of long-term assets, such as property, plant and equipment, as well as investment securities. If a company buys a piece of machinery, the cash flow
statement would reflect this activity as a cash outflow from investing activities because it used cash. If the company decided to sell off some investments from an investment portfolio, the proceeds from the sales would show up as a cash inflow from investing activities because it provided cash.
The third part of a cash flow statement shows the cash flow from all financing activities. Typical sources of cash flow include cash raised by selling stocks and bonds or borrowing from banks. Likewise, paying back a bank loan would show up as a use of cash flow.
Comments on the Nortel Cash Flow Statements
- Net cash generated from operating activities fell sharply in 2000 and 2001, compared to previous years. This is because, as mentioned in the previous part of this article, sales came down, customers took longer to pay or eventually did not pay at all.
- Net cash used in investing activities grew significantly in 1999, 2000 and 2001 compared to previous years. Part of the Nortel buying binge over those years was financed with cash and part was financed by issuing stock.
- Net cash from financing activities was significantly larger in 2001 compared to previous years. Nortel had to raise cash through loans and selling stock. It raised almost $3B in that year, without which Nortel would have almost run out of cash. Financial Statements contain a wealth of information!
I hope that this article has stimulated you to learn more about this topic, which is absolutely necessary to managing a successful photonics startup. If you have any questions or comments please contact me at IPSNEWSLETTER@IEEE.ORG
References
[1] Nortel Networks; Annual Report 1998
[2] Nortel Networks; Annual Report 2000; Unleashing the potential of the high-performance Internet.
[3] Nortel Networks; Annual Report 2002
About the Column
This is a regular column that explores business aspects of technology-oriented companies and in particular, the demanding business aspects of photonics startups. The column touches on topics such as financing, business plan, product development methodology, program management, hiring and retention, sales methodology and risk management. That is to say, we include all the pains and successes of living the photonics startup life.
This column is written sometimes by me (Daniel Renner) and sometimes by invited participants, so that we can share multiple points of view coming from the full spectrum of individuals that have something to say on this topic. At the same time, this is a conversation with you, the reader. We welcome questions, other opinions and suggestions for specific topics to be addressed in the future.
The expectation is that this column will turn into a useful source of business-related information for those who intend to start, join, improve the operation, fund, acquire or sell a photonic startup. A fascinating area that I have been one of those lucky to enjoy as a way of living for a long time
A Bit About Me

I (Daniel Renner) grew up in the wilderness of Chilean Patagonia, which is one of the sources of my quest for adventure and for exploring new areas. In my early twenties I went to the University of Cambridge in England to do a Ph.D. in Opto-Electronics, a new area at the time. Now, decades later, I have lived through the whole range of experiences that relate to the development, manufacturing and commercialization of complex photonic devices and systems used in communication, sensor and industrial applications. My experience spans both technical and commercialization aspects of photonic products. This experience has included both large and small companies, which gives me a reasonable vantage point to comment on the ups and downs of life in a photonics startup.
I am currently Chief Business Development Officer at Freedom Photonics in Santa Barbara, CA, and I look forward to the regular conversation to be carried out through this column!